
Prismatic Capabilities
Prismatic can transform complex data into clear, actionable insights for everyone.


Multi-Dimensional Presentations
Pull in models of anything you want to understand or communicate better visually: a molecule, an engine, a cell, a 3D design, a vehicle...whatever you can think of. Use the existing libraries, upload your own, or use your own description to have AI create a model for you.


Infinite Extensibility
Shards are plugins that bring additional unique capabilities into Prismatic.
By adding and combining shards in prismatic, you open up a kaleidoscope of possibilities. Network management, network security, patch awareness, cyber warfare, orbital systems, risk management, supply chain management, organizational management, data analytics, operations planning, and more can be combined to create powerful capabilities.
Visualize Complex Data
Transform your data perception and communication with our multi-dimensional visualization systems.
Network Management and Security


Have a network with thousands of nodes, and have trouble understanding the status of them all? Prismatic allows you to see them.
Managing network security for an enterprise, and trying to manage security boundaries? Prismatic offers a clear visual understanding of your current posture, ideal for communicating the information to non-security professionals.
Do you want to reach it all from one place? Prismatic is the center of your world.


Optimizing Efficiency
Juggling multiple graphs, charts, and spreadsheets can take complex interactions and clearly identify best avenue of approach, critical concerns, outliers, or future states. By identifying transitions over time, optimal pathing can be identified for desired end goals.
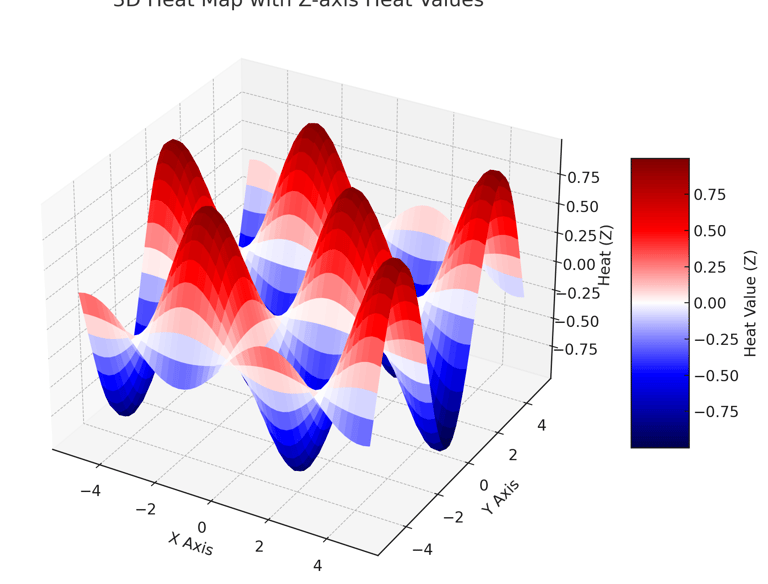
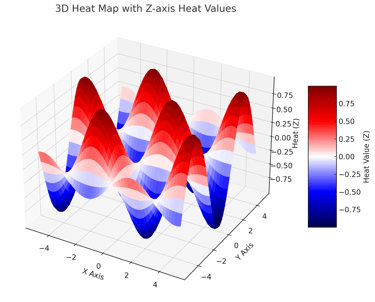
Dimensional heat maps aren't new--but making them accessible, understandable, and flexible is. Dive deep into your data, rotate and reposition your perspective, and share it with a crowd.
When examining complex workflows such as forensics or operational planning, being able to simultaneously view and understand all factors in play is absolutely critical.
More challenging still, not all decisions and workflows simply require data--some require mapping data to locations. Whether planning an orbital data exchange, a operation with different assets, a network route across the globe, strategic global initiatives, or simply identifying supply chain weaknesses, Prismatic can help.